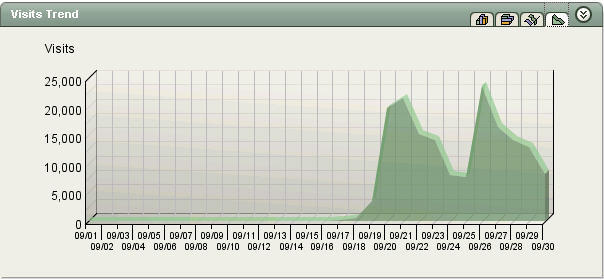
 In August and through most of September, Martin's site averaged around 30 visits per day. On September 19, BoingBoing posted a link to the site and since then, things haven't quite been the same. Traffic spiked up to 20,000 visits on that day, and has bounced around quite a lot in these subsequent weeks. Note this graph showing the number of daily visits across the month of September...yes, there are visits for the first 18 days of the month...they are obviously dwarfed by the traffic late in the month. BoingBoing's post was clearly bringing visitors to the site.
What's extraordinary about the nature of the reach of sites like BoingBoing is how quickly posts are spread through other bloggers. Many small sites picked up the post, as did some larger sites. As you can see from the visits graph above, traffic tapered off after a day or two from BoingBoing as it was no longer on the home page. But enough other smaller blogs were able to make up the difference and then some through the next few days.
Location, location, location
 So, who are these visitors? Are blog-referred (blogerred?) visitors any different than other visitors? As BoingBoing is savvy enough to post their own stats, we know that the site is viewed by over 2M unique visitors per month. Unfortunately, their "countries" report is broken at the moment, so we can't determine the geographical distribution of their reach directly. But here's a geography drilldown report showing where the visitors to LiquidSculpture were coming from on September 20 with Western Europe expanded to show how many visits were from Sweden!
Referrers make all the difference
When analyzing blog/RSS data, one very important metric is referrers. Bloggers should keep a close eye on who is driving traffic to their site. The graph below is terrific as it shows a few things pretty clearly. 1) Make sure your ISP is ready for peak traffic! As you can see, there was a bit of a drop (ok...a complete drop) in traffic as Martin's ISP responded to the load of the day. 2) The referring traffic mix changed over the day as MetaFilter then Digg followed up on the BoingBoing post. 3) Many visitors followed up by posting tags to Del.icio.us, where it became one of the popular items for the day.

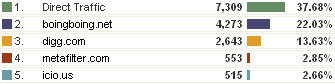
Another thing that jumps out when analyzing this data: Why are there so many "direct traffic" referrers? Are people actually typing in the URL into their browser? Or getting an email and clicking on a link (from Outlook or some other non-browser based email tool)? I believe it's something new that web analytics tools are only beginning to comprehend properly - these visitors are looking at sites like BoingBoing through RSS/news readers. They are clicking on the link from within their RSS reader and opening a new browser...thus no referrer. Note that you do get a referrer from visitors using web-based browsers like Bloglines (Bloglines was the 8th most common referrer for September 20th - the highest referrer for any feed aggregator - I sure wish we knew which readers folks were using!).
Side Bar
Note that LiquidSculpture has not been picked up by slashdot, but if it is, referrers will be much easier to measure. Slashdot does not provide links in their feeds, so readers who wish to find out more information about a referenced site need to first go through slashdot. Smart marketing? Hmmmm. Regardless, it is definitely true that BoingBoing is not completely accurately measuring their readership (they don't know if I read an article or not, or visit a link that they reference), nor can sites accurately know how much BoingBoing traffic has been referred to them.
Money matters
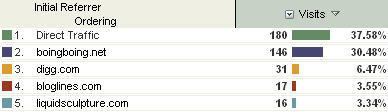
Of course, Martin does sell his unique art, but he does not have any commerce mechanism directly on his site. Visitors to his "ordering" page can email him to make orders, or visit cafepress for a few items they distribute for him. I was curious whether BoingBoing readers were more or less likely to visit the ordering page, so I ran a report to breakdown visits to the ordering page by initial referrer to the site. As you can see, even though BoingBoing readers directly accounted for 22% of the visits to the site (from the stats above), they accounted for 30% of the visits to the ordering page. MetaFilter visitors and Digg visitors were less likely to visit the ordering page based on overall visits from those sites.
What about the browser war?
And the browser of choice for all of these fabulous new visitors? Let's just say it isn't IE - which only accounted for 33% of the visits on September 20. Firefox led the way with over 50% of the visits, and Safari came in 3rd at 10% of the visits. I've been pondering why the number of Firefox visits is so much higher than what BoingBoing sees, but their stats are showing hits and I'm using visits, so it's obviously not a perfect comparison. Also, I imagine that a lot of RSS readers send the agent string for IE + the reader name, so they probably get lumped into the IE stats.
Let me know if you have any comments or questions about this data. Many thanks to Martin for the wonderful art, access to some excellent data, and for putting up with my endless questions!
Filed in: liquidsculpture analysis
Thanks Guy. Your segmentation numbers make good sense to me!
ReplyDelete