Data Gathering
The idea is relatively simple. Create a spreadsheet of geography data from your analysis tool, then run a macro against it to create the XML data to feed into Yahoo! Maps. So, let's start with gathering the geography data.
Using WebTrends, I ran a Geography Drilldown report for the month of October. You c
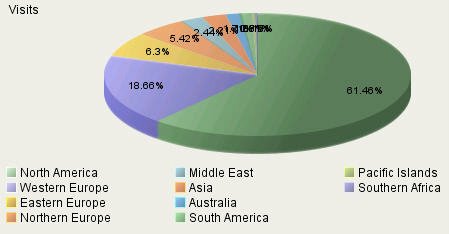 an see in this pie chart that ~61% of the visits to LiquidSculpture were from North America. The Yahoo! Maps data is limited to North America as far as I can tell, so we'll stick to that geography for now.
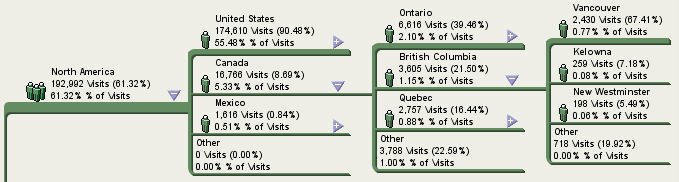
Drilldown Data
This drilldown shows further granularity into the data (North America -> Canada -> British Columbia -> Vancouver), noting that visits from visitors in Vancouver, B.C., make up .77% of the overall visits during the month. Martin demonstrated his photography at a show in the San Juan Islands a year ago, perhaps his Vancouver visitors should get a special invitation next time he's up in that neck of the woods.
Get Out The Map
So, let's get some data on a map. Now that we have the data, we need to export it. After running the Geography Drilldown report in WebTrends, I exported the data to a CSV file (you could use the Excel export functionality too, but the CSV export works great in this example). I then modified Jeffrey's Excel template to select the cities out of the exported data to create the map below.
 You can see the map above by referring to this link which pulls the XML data from a saved file.
Technical Notes
Yahoo! Maps is easy to use and very flexible. You create a XML file and feed it to their API. There are other tools available via the API that I'm not taking advantage of - perhaps if there's enough interest, I'll dig into it further.
If you use WebTrends, you should be able to use the same Excel template I used to map your visit data on Yahoo maps. Please note that this is not a WebTrends product. It is not endorsed or supported by WebTrends. I'd be happy to help provide some help if you are having difficulty using it. Even if you don't use WebTrends, but your analytics package provides you with geography data that you'd like to map, you're welcome to use my template, or grab Jeffrey's original template and hack away.
My template includes a few changes to the original:
- I created "groups" which allow a categorization of the data for different colored icons. I set them to greater than 1%, .05-1% and less than .05%. Feel free to modify those values in the macro if you need to - I've highlighted the two areas that need to be changed with a *** in the comments
- I have modified the instruction box to note that you should sort the data by visits (and pageviews) before mapping it. The reason is that the WebTrends CSV export sorts the data by geography first. If you have a large dataset, you may miss other geographies unless you sort the data by visits first.
- The macro is looking for a few specific items that are in the WebTrends CSV exported file. If you're not using WebTrends, and are having difficulty making it work, try Jeffrey's original template.
Let me know if you have any feedback or questions on this.
No comments:
Post a Comment