facebook sdk

google tag manager

Wednesday, December 19, 2012

Webtrends Streams Visualizations - Inspired

As I noted previously, with Webtrends Streams you can "see" things you haven't been able to see before.  The fantastic challenge for us as we were starting to put it together was, now how do we show it?  How do you provide a new lens into this new type of data?  We had put together an incredibly powerful API, but that API data isn't really made for traditional data visualizations as the data is much more "alive".  It is constantly moving, and flows as your visitors, and your customers, and your mobile app users interact with your sites and apps.

Let me take a step back, and explain a little more about the data.  Webtrends Streams is an enriched stream of event-level data.  It's not traditional pre-aggregated data that you find in real-time solutions.  You subscribe to a stream of data, filtered and segmented to only see the data you're interested in, and as each event occurs, it's delivered to you.  If you want to see more technical details, to the right is a small snippet of an event (in this case, a visitor arriving on a web page) that I just captured to show what I mean.  Note that this is a very small snippet of all of the data that comes back.  Every possible element that is collected, plus the additional enrichment we're adding in, can be consumed by you through subscribing to streams that are of interest to you.

Our first look at the data was even more rough than what you see above.  It was our "bare bones" UI, and it was developer friendly, but didn't make much sense beyond the engineering floor at Webtrends.  We started to think about how we could present it that might make sense to us, and came up with a few interesting views of the data, but realized that we needed to open it up to a wider team of creative folks.  So we did what any respectful development team would do - and we brought in a bunch of food, and being in the great northwest, there might have been some beer there as well, and had one of our best Developer Day events ever.

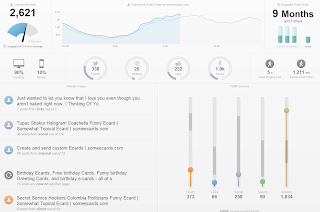
The results from that day inspired us.  We realized that these visualizations gave us the lens we were looking for to "show" Streams.  You can see a couple of examples in this video we created (no need to watch me...just skip to 16 seconds in and 40 seconds in).  And the good news is that all of the visualizations were all built in html, css and javascript, so the development time is quick, and deployment is easy.  There are so many powerful javascript libraries now for animating data (see the absolutely amazing work from Mike Bostock at the NYTimes, and others working on d3 as examples), that there's no excuse for building static reports anymore.  Your data is alive.  Your visualizations should reflect that.

At this point we knew we were on to something big.  Not only was the data extremely compelling, but now we had a way to show it.  A new way to express as-it-happens data.  Instead of just explaining to customers that they can use the data to understand what's going on right now, we could show them.  Are you launching a new site, or app, or campaign?  Wouldn't it make sense to:

  1. Be able to validate that everything is setup as expected prior to launch, and troubleshoot any last minute measurement issues
  2. "See" each visitor as they are arriving, knowing how they got there, and what looks to be of interest
  3. Immediately validate whether your ad and search spend is working
  4. Note if your visitors are experiencing any errors, or trouble converting as expected, and fix those issues - while those same visitors are still on the site

These new visualizations gave us visibility into all of this level of understanding - and more.  And the visualizations immediately resonated with our early adopter Streams customers.  So much so that they asked for more, and started building out their own as well.  Tell me, how awesome would it be to collaborate with your customers to create previously unheard of visualizations, and help them show off their data inside their company?  Our customers are already doing this with us.  And their work is truly inspiring.

Although we set out to provide Streams as a new API, we pivoted quickly and instead have created some fantastic visualizations to accompany the rich API data.  Rather than show a bunch of screenshots of those visualizations (which do not do them justice at all), I'm going to create some videos to show it off.  Look for those soon, and feel free to drop me a line (elbpdx @ gmail) if you'd like to chat more about all of this cool work.

Monday, October 22, 2012

Webtrends Streams: Behind the Scenes

Webtrends Streams is amazing.  It's different.  A fresh, revolutionary idea (or, set of ideas really), that will fundamentally change how we think of digital analytics.  You will want to see it, very soon, and it will blow you away.

I'm proud to be part of the team putting this innovation together.  What we originally set out to do was to reinvent real-time analytics.  It was a great time for us to rethink our approach to real-time data for several cool reasons:
  1. Campaigns, and verticals like media, retail and travel, are requiring analysis sooner:  In the summer of 2011 we had just created a powerful new tool to collect and analyze Facebook campaigns.  In doing so we analyzed tens of thousands of Facebook posts and determined that any given post at that time had a shelf-life of 11 hours.  That was a real eye-opener.  Marketers only have a few short hours to determine whether a post (a micro-campaign if you will) is succeeding or not, and whether to double-down on the post (sponsored post, other potential sources), or whether to get the next post ready to rollout.
  2. Real-time innovation through Reinvigorate: We were lucky enough to acquire Reinvigorate, still the best real-time solution available on the market today.  Behind the excellent product is some very smart IP that we immediately poured into a new Heatmaps solution, creating our first real (very) big data infrastructure.  Also behind that was a new approach to real-time data (well done Sean!).  With Reinvigorate, you know, immediately, who is on your site (or using your app).  You can tell how many active visitors are currently viewing any page.  It's very powerful, and got us thinking.
  3. Killer technology shared by other creative companies: Twitter, LinkedIn, Facebook, and others, were starting to release and share more mature open source projects that begin to offer incredibly reliable, stable, rapid data movement to support the difficult task of true real-time requirements.
So, we started prototyping new real-time analysis tools...and it didn't quite feel right.  It felt incomplete, and "only" evolutionary.  It was incredibly robust, enriched with additional data, and faster than anything else available, but that didn't feel like enough of a win to make a major investment to complete.  There are definitely places where real-time data is important, and it can fundamentally move the needle for organizations that need it.  But we thought we could do more.

We started experimenting with the idea of expressing the data we collect differently.  What might it look like to enrich the data we're collecting, and then send it out an API as soon as it is collected?  What if we could also offer our customers the ability to subscribe to receive all events, or just a subset of events they are interested in?  And if they only need certain variables (parameters), let's reduce the stream of data to only include those variables on each event.

We ended up building new data viz's as well...
I still remember the time Andrew showed me the data flowing through the Streams API.  I work with a bunch of very smart people, and we were all blown away at what we were seeing.  Now it started getting fun.  We knew were were on to something special.

For the first time, we could "see" all views, events, clicks, plays, pauses, opens, closes, Likes, comments, add-to-carts, purchases, scenario steps, searches - EVERYTHING - as it happens.  Yep, as it happens.

Oh, and are you interested in focusing the data to specifically see product views, add-to-cart, or other scenario events?  Just filter the stream to only send those events.  What about watching referring sources, campaign IDs, and resulting landing page?  No problem.  How about all video starts, or % complete, or errors even?  Easy.  Curious how many people are using your mobile app right now, and which content is being viewed broken down by city and mobile device type?  You got it.

We're really proud of how flexible and powerful Streams is.  And we are just getting started...wait till you see what we have in store next.  Let me know if you want to see it...it's very cool.  I'll post more later, but for now...start here: http://trnd.me/PMdrl5

Monday, April 16, 2012

Congratulations to Chartbeat

Many congrats to the Chartbeat team, closing a new round raising $9.5M.  They've done a great job of pushing the real time story deeply into the analytics world, and are pushing through three major ideas at the moment:

  1. Engagement.  Real-time engagement is a very smart idea, and will be very useful for sites who are looking to really understand what's of interest by their visitors.
  2. Data in context.  Very smart.  It's one thing to see a number, or even a trend, but is it good?  Or bad?  Context matters.
  3. More data.  Mobile devices and social activities are critical to understanding the big picture.
They've updated their look as well, with a data-viz look to their site, and new dashboard views within the product.  All good things.  Well done.

Friday, March 30, 2012

My SAO Ignite Presentation

A couple of weeks ago I gave an Ignite presentation for the SAO Ignite v2 event.  I've been to Ignite events before, but this was my first time up on stage.  I had a great time putting together the presentation, and the event itself was fantastic.  It's quite a challenge to condense a topic into 5 minutes with slides auto-advancing every 15 seconds!

The Story

I wanted to create a presentation that was more of a story than a typical slide show.  I've created many technical presentations in the past, but I really wanted to just tell a story for this.  My topic was around the fun ongoing project I've been working on with Schoolhouse Supplies, a local non-profit dedicated to providing school supplies to kids in need.

The message I wanted to get across was:
  1. Background on this fun project I created (Schoolhouse Supplies Online) to leverage the talents of the non-profit to sell supplies to parents who can afford it, thus providing a revenue stream for the organization, and offering an opportunity to reach out to more potential volunteers and donors.
  2. How it has made a difference to the organization, and to our community.
  3. And hopefully inspire others to get involved.  There are many great opportunities out there for folks to use their tech ninja skills and ideas, and make a difference in our world.

The Slides

I did something I've never done before when preparing the slides.  I wrote my story first.  Just the story.  Text.  No pictures.  No keynote or powerpoint.  Just the story.  I edited it, read it aloud, edited it, etc.  Trying to get everything I wanted to say into 5 minutes.

I then went back through and started timing individual 15 second segments, breaking up the story into a couple of sentences at a time.  When it comes down to it, you really only get a couple of sentences per slide.  It's not a lot!

I then started looking for pictures.  I didn't want bullets.  Just pictures to support the story.  Finding photos to use that are licensed for public use can be a bit of a challenge, but Flickr pulled through nicely.

The Presentation

I've been working on this project for six years now, so I know it well.  The story was easy to tell as I've told it many times over the years.  The challenge was that I've told the story so many different ways over the years that I couldn't stay on track when practicing with the slides that I had submitted.  Every time I went through it, I was using different examples and anecdotes, and I was starting to get worried I wouldn't make it through!

After practicing it through, probably 20 times on the day of the event, I finally got it down.  I'm pretty happy with how it all turned out.

Many thanks to the SAO staff for putting together a great event.


Tuesday, March 27, 2012

Heatmaps and Big Data

At Webtrends, we've been having a blast getting our latest big data environment configured, tested and rolled out over the last several months.  This newest installment, supporting our killer new Heatmaps functionality, is based on Hadoop (and HBase and Hive).

We've been leveraging massive SQL and NoSQL big data infrastructures for years, but it's particularly fun to add the distributed mapreduce functionality of Hadoop into the mix to give us new slices of the data.  This new platform is similar to how our Reinvigorate environment is configured, but built for many times the volume of traffic.

And I'm really happy with our approach rolling it out.  We've created an infrastructure to support our incredible volume of data, and we've chosen to start with a controlled use case, and incrementally add data and functionality, so as to prove the scale.  As the industry is learning, it's relatively easy to build an analytics solution based on Hadoop, but it's extremely difficult to do it at scale, securely, with solid operational processes behind it.

One of the ways we're helping to ensure the success of this rollout is by thoughtfully thinking of the incoming data.  The data required to support Heatmaps is well defined and contained to click events captured through our new v10.2 async javascript tag.  This provides us with a use case that is contained, relatively straight-forward to test, and yet provides really high value for Marketing folks and web developers to make quality decisions when optimizing their websites (or Facebook Apps, etc.).

Our amazing UX team had some fun with the Heatmaps data, and even added in a couple of surprises that were very smart, and relatively easy to implement.  My favorite is the date compare transition, where the Heatmap overlay smoothly transitions from one time range to another.  So cleverly done!

The best part of all of this?  This is only the beginning of what we believe to be a huge opportunity to create very compelling solutions around the volumes of data we collect and analyze for our customers.  I think they are going to like what they see in the coming months/years from Webtrends.

So long Konfabulator

Almost missed this.  Yahoo is discontinuing development and support of the "yahoo widgets" (Konfabulator) platform.  From their EOL statement:
  • Yahoo will be discontinuing development and support of Desktop Widgets as a product
  • After April 10, 2012, the Desktop Widget Gallery website for downloading new and updated desktop widgets located at widgets.yahoo.com will not be operational.
  • The existing Desktop Widget Engine, Yahoo! and 3rd party desktop widgets in distribution on desktop PCs and Macs, may continue to operate under arevised terms of use.
I give the Konfabulator team a lot of credit for creating the first real cross-platform App platform.  It was easy to develop fairly powerful apps (widgets), and make them easy to use.  Well done.

Of course, they missed a few opportunities along the way, including the now obvious iOS and Android revolution.  Bummer for Yahoo.

What's strange in all of this is that there's definitely still an appetite for desktop widgets.  It's not like the demand has gone away.  The Chrome approach doesn't seem quite right, and even Apple hasn't totally nailed this particular need.  Is something else out there?

Saturday, February 25, 2012

Facebook Insights Delays and Changes

All analytics solutions eventually suffer through "delays". We had some pain back in the early days of Webtrends Live when we might fall behind by a few hours (the solution was originally designed to provide data in less than one hour). Facebook has consistently had an terribly long delay of a "couple of days" for their Insights data since they launched their service. They are today telling Page admins:
Insights Delays
During the past few weeks you may have noticed delays to your insights data. We're sorry for the inconvenience this may have caused and want you to know that we're working to resolve these issues and make sure they don't happen in the future.
Their delays have been close to a week in recent weeks. Bummer. It's hard to run an effective Marketing campaign if your data is a week old.

They've also recently made some changes to their data...telling Page admins:
Improvements to Page Insights Data
You might notice an update to the data you see on the "Likes" and "Reach" tab of your Page Insights. We've made some changes to improve the accuracy of the information you have about the location of your audience.
Making changes to how data is calculated is always tricky.  It's hard to convey to your customers what you are doing, and it raises doubts about the accuracy of the prior data - and what else might change along the way.

My advice for the Facebook Insights team: communicate early and often.  It's always better to let folks know what's up early, and fall on your sword if need be.

Tuesday, February 14, 2012

Realtime Relevance

We are working on some killer technology right now to enable clever analysis of data via new streaming services (the stuff behind the realtime efforts of Twitter, Facebook and LinkedIn). We're building on top of what we've done to leverage realtime data in Webtrends A10, Optimize and Reinvigorate, and it's starting to really get fun.

Our Marketing team is also out in front of the conversation...here's the latest from them:

Monday, February 06, 2012

It's a good time to be at Webtrends...

I joined Webtrends in '99. The company had just gone public and we were growing like crazy. Our flagship Webtrends software products (LogAnalyzer, Professional Suite, and Enterprise Suite) were minting money, and we were just starting to get some traction with our new "online" tool called Webtrends Live (later renamed Webtrends OnDemand).

In Q4 of that year we had an internal goal to hire 100 people across the organization. We did just that...while the business was still accelerating. It was a fun time.

Flash forward to 2012. Our SaaS solutions revenue grew over 20% last quarter from the previous year, with earnings up an incredible 418%. And we just announced last week that we're going to be hiring 50 new employees - 35 in engineering alone.

The difference this time? It's not a bubble. At least not for Webtrends. We're making money, we're growing, and instead of sitting back and watching it slowly, organically, grow, we are putting our foot on the accelerator.

Want the inside scoop on what we're up to? Take a look at our job openings. A lot of great opportunities all around the company. Make sure you look at some of the engineering jobs to see what we're putting together: streaming/realtime processing, big time big data, deep data mining research, and incredible (award winning) user experience initiatives.

It's a good time to be at Webtrends. If you want to work on the latest technology, serving some of the smartest marketing brands in the world, now's the time.

addthis

webtrends reinvigorate analytics